GUI
Here I will try to collect all the ideas and decisions made regarding the GUI.
Prototype
The (probably deprecated) prototype for creating views is here! The links/buttons you have to click in order to proceed through the full demonstration (as it is all fake functionality) is the following (instructions in brackets do not need to be followed in this dummy, but would have been done if the functionality were real):
"+", (select song_yinxing), "use this table", (check place_pinyin, date, gis_id), "use these columns", "gis_id", "insert_data", (select gis_locations), "use this table", (check the two coordinate columns), "use these columns", finish.
Concepts
First the user has to enter the working environment through the public website and login page/box.
The working environment consists of workspaces, which are composed of blocks.
All interaction with the mapping and database system works through these basic concepts.
At every instant, there should be tooltip information explaining the functionalities or giving a hint what next steps the user could take to continue with a workflow, so they don't feel left alone.
Technology
The GUI is implemented using jQuery (v1.4), and to this point, the following plugins are also used: ClickMenu, datatables, liveQuery, tooltip.
The Icons were taken from iconarchive.com.
Structure
The code produced until now is structured as follows:
- there are 2 templates for the home-workspace and normal workspace; these both have a "slot" (<div id="moduleslot">) where one block is preloaded (the home/workspace-block)
- every block has a template (that uses the "blocks/template"-Page Tempalte as a basis) and it's own css and js file which are included/loaded in the workspace templates and which contain code that is only needed in those blocks
- the basic block behavior is implemented in "lib/blocks.js"
- all the jquery libraries needed exist as files in the folde "lib"
Known Issues
- the ClickMenu? is somewhat difficult to handle; I haven't found out yet how to access onClick events from it
- the parameters in the addBlock method in blocks.js and the way how blocks are addressen by jquery, are pretty cumbersome and should be redone properly
Additional Information
The editor that I use for editing the Page Templates and JavaScript files is emacs.
As long as the FTP server is enabled on the zope server, the files inside zope can be accessed with emacs with the "Find file"-command (Ctrl-x Ctrl-f), and then entering /ftp:USER@chinagis.mpiwg-berlin.mpg.de#8021:/PATH/TO/FILE. Confirming this (by pressing return) will ask for the password for USER and then open the file (or directory).
Project title
History/Time? GIS/Space/Place Analysis Display/Publication/Viszualization? PitMap? Places it Time mapPIT.mpiwg-berlin.mpg.de map Places in Time
New Welcome Site
Herzlich Willkommen bei China GIS!
Diese Website bietet Ihnen eine Plattform für die Erstmals hier? geografische Darstellung und Analyse historischer Daten.
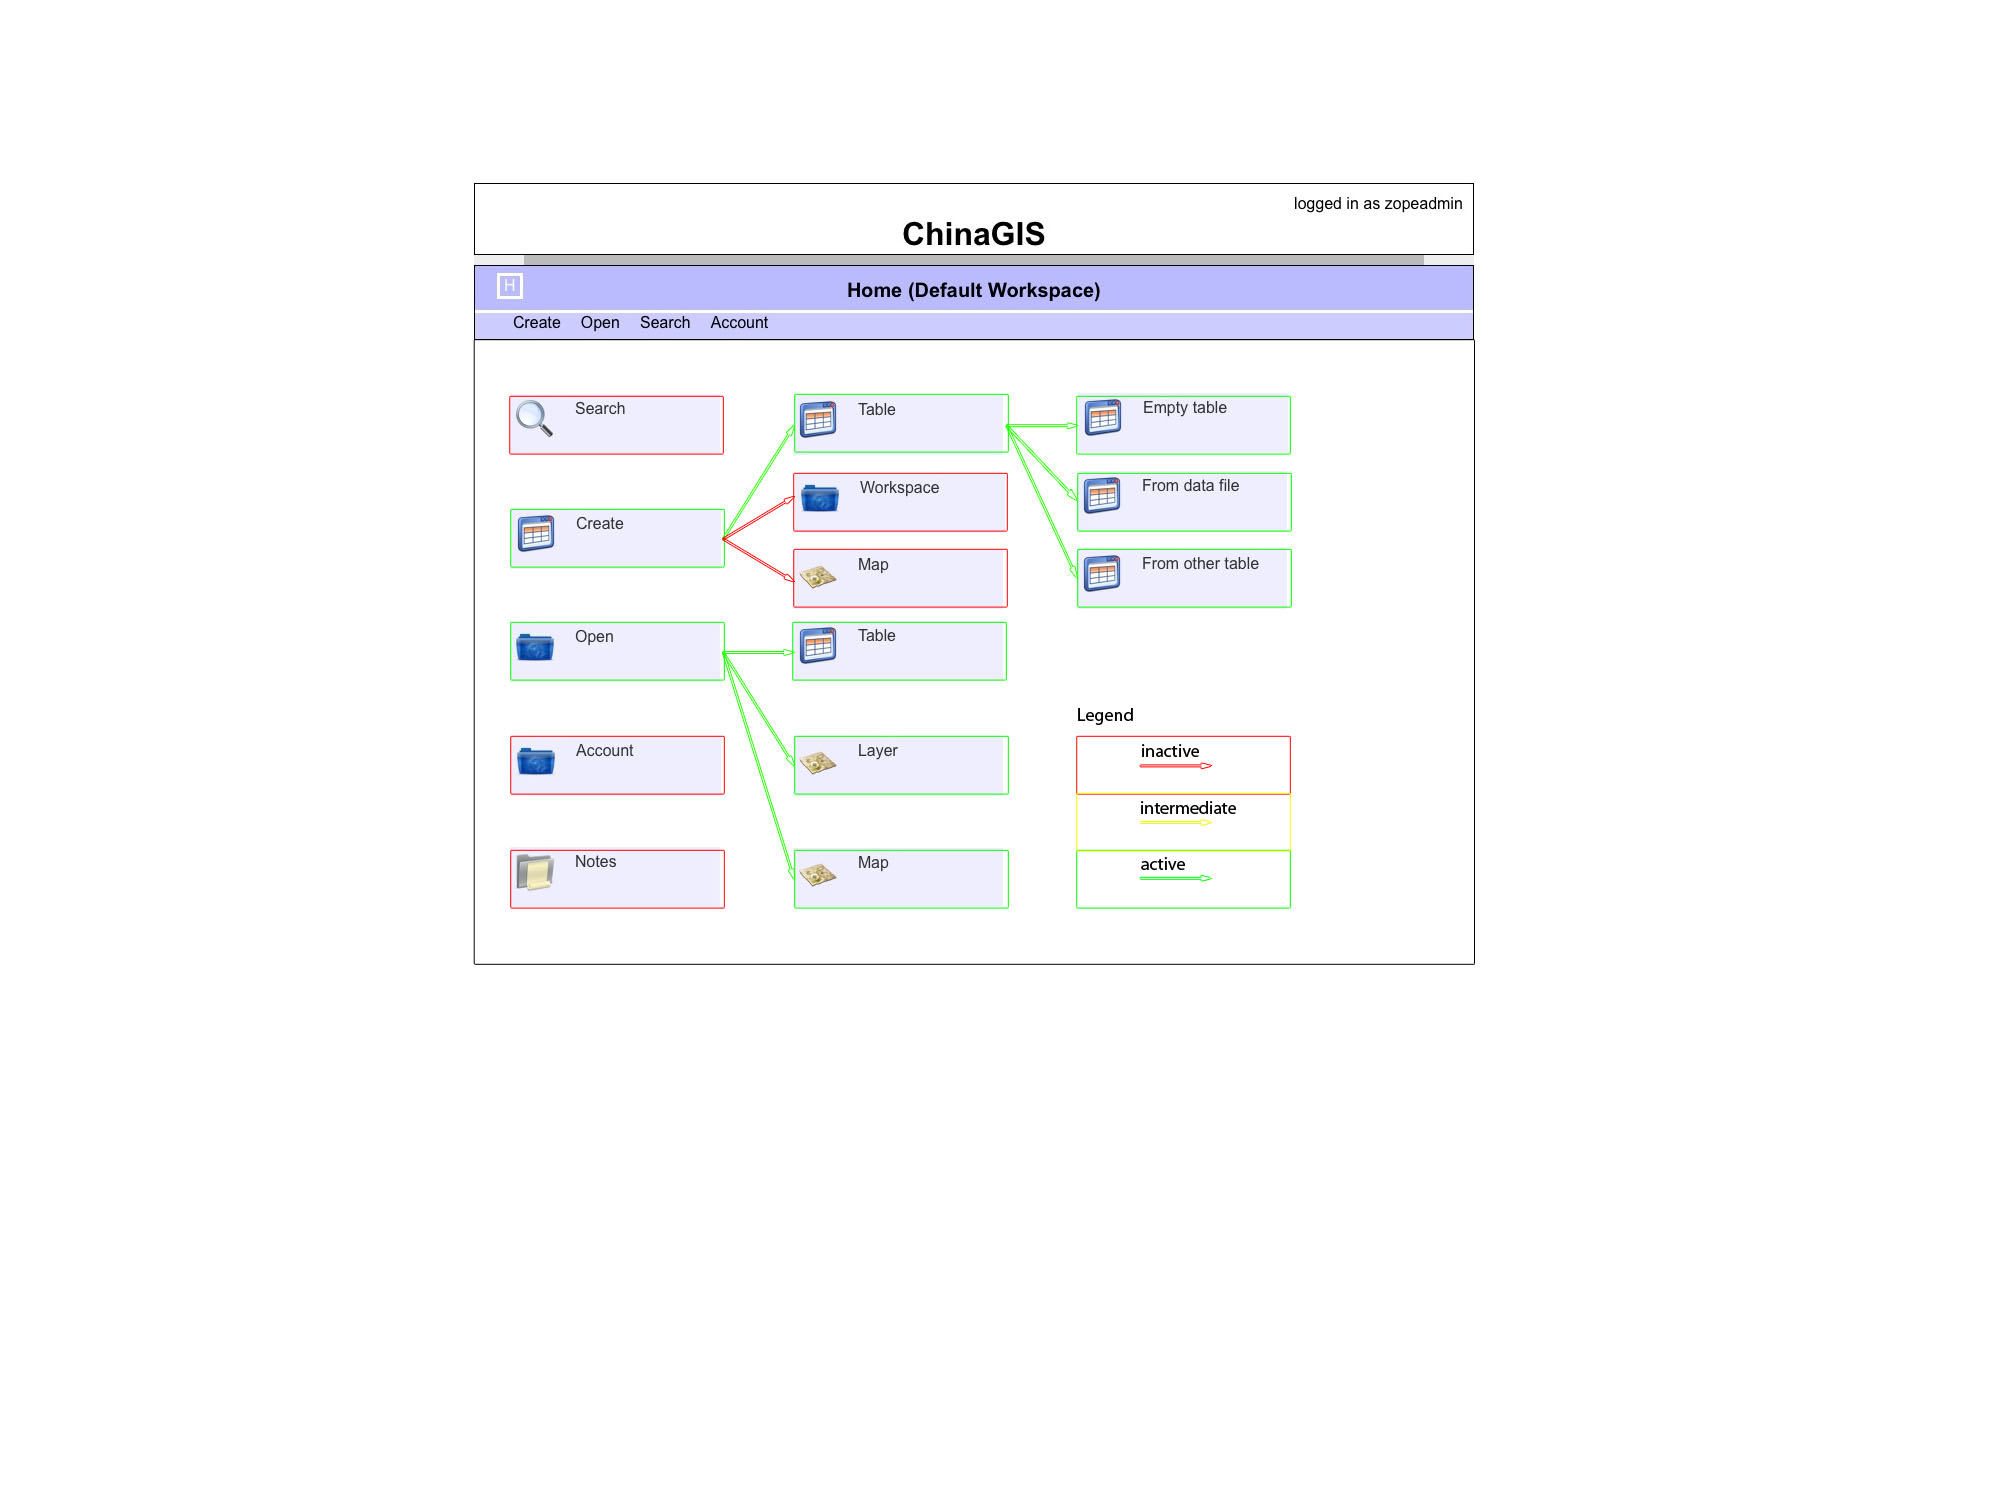
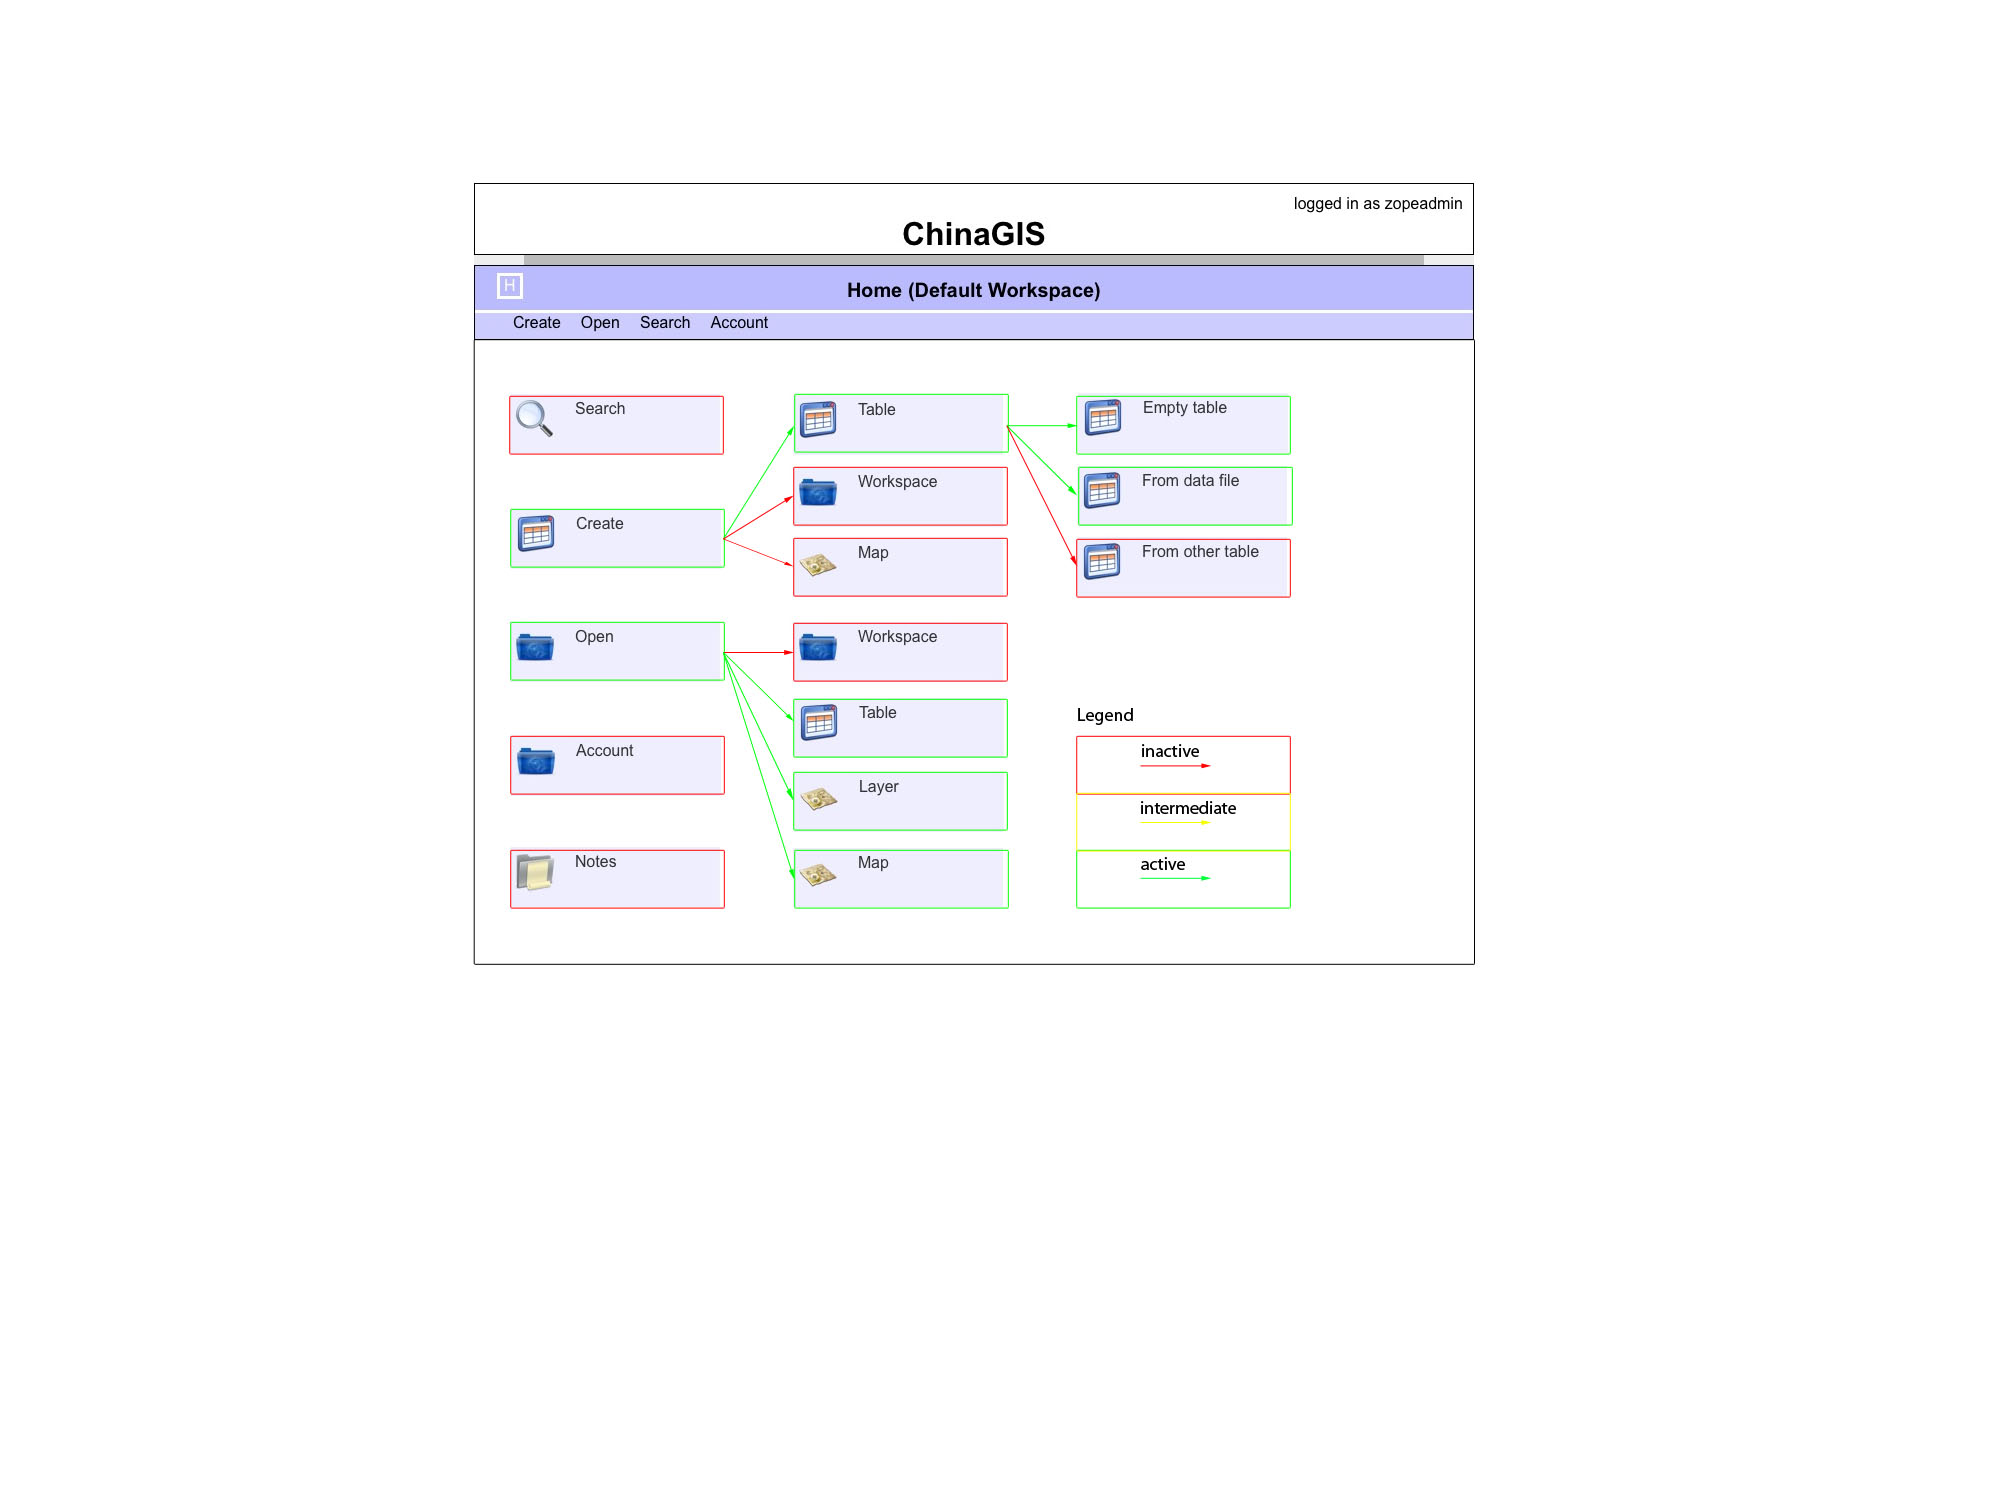
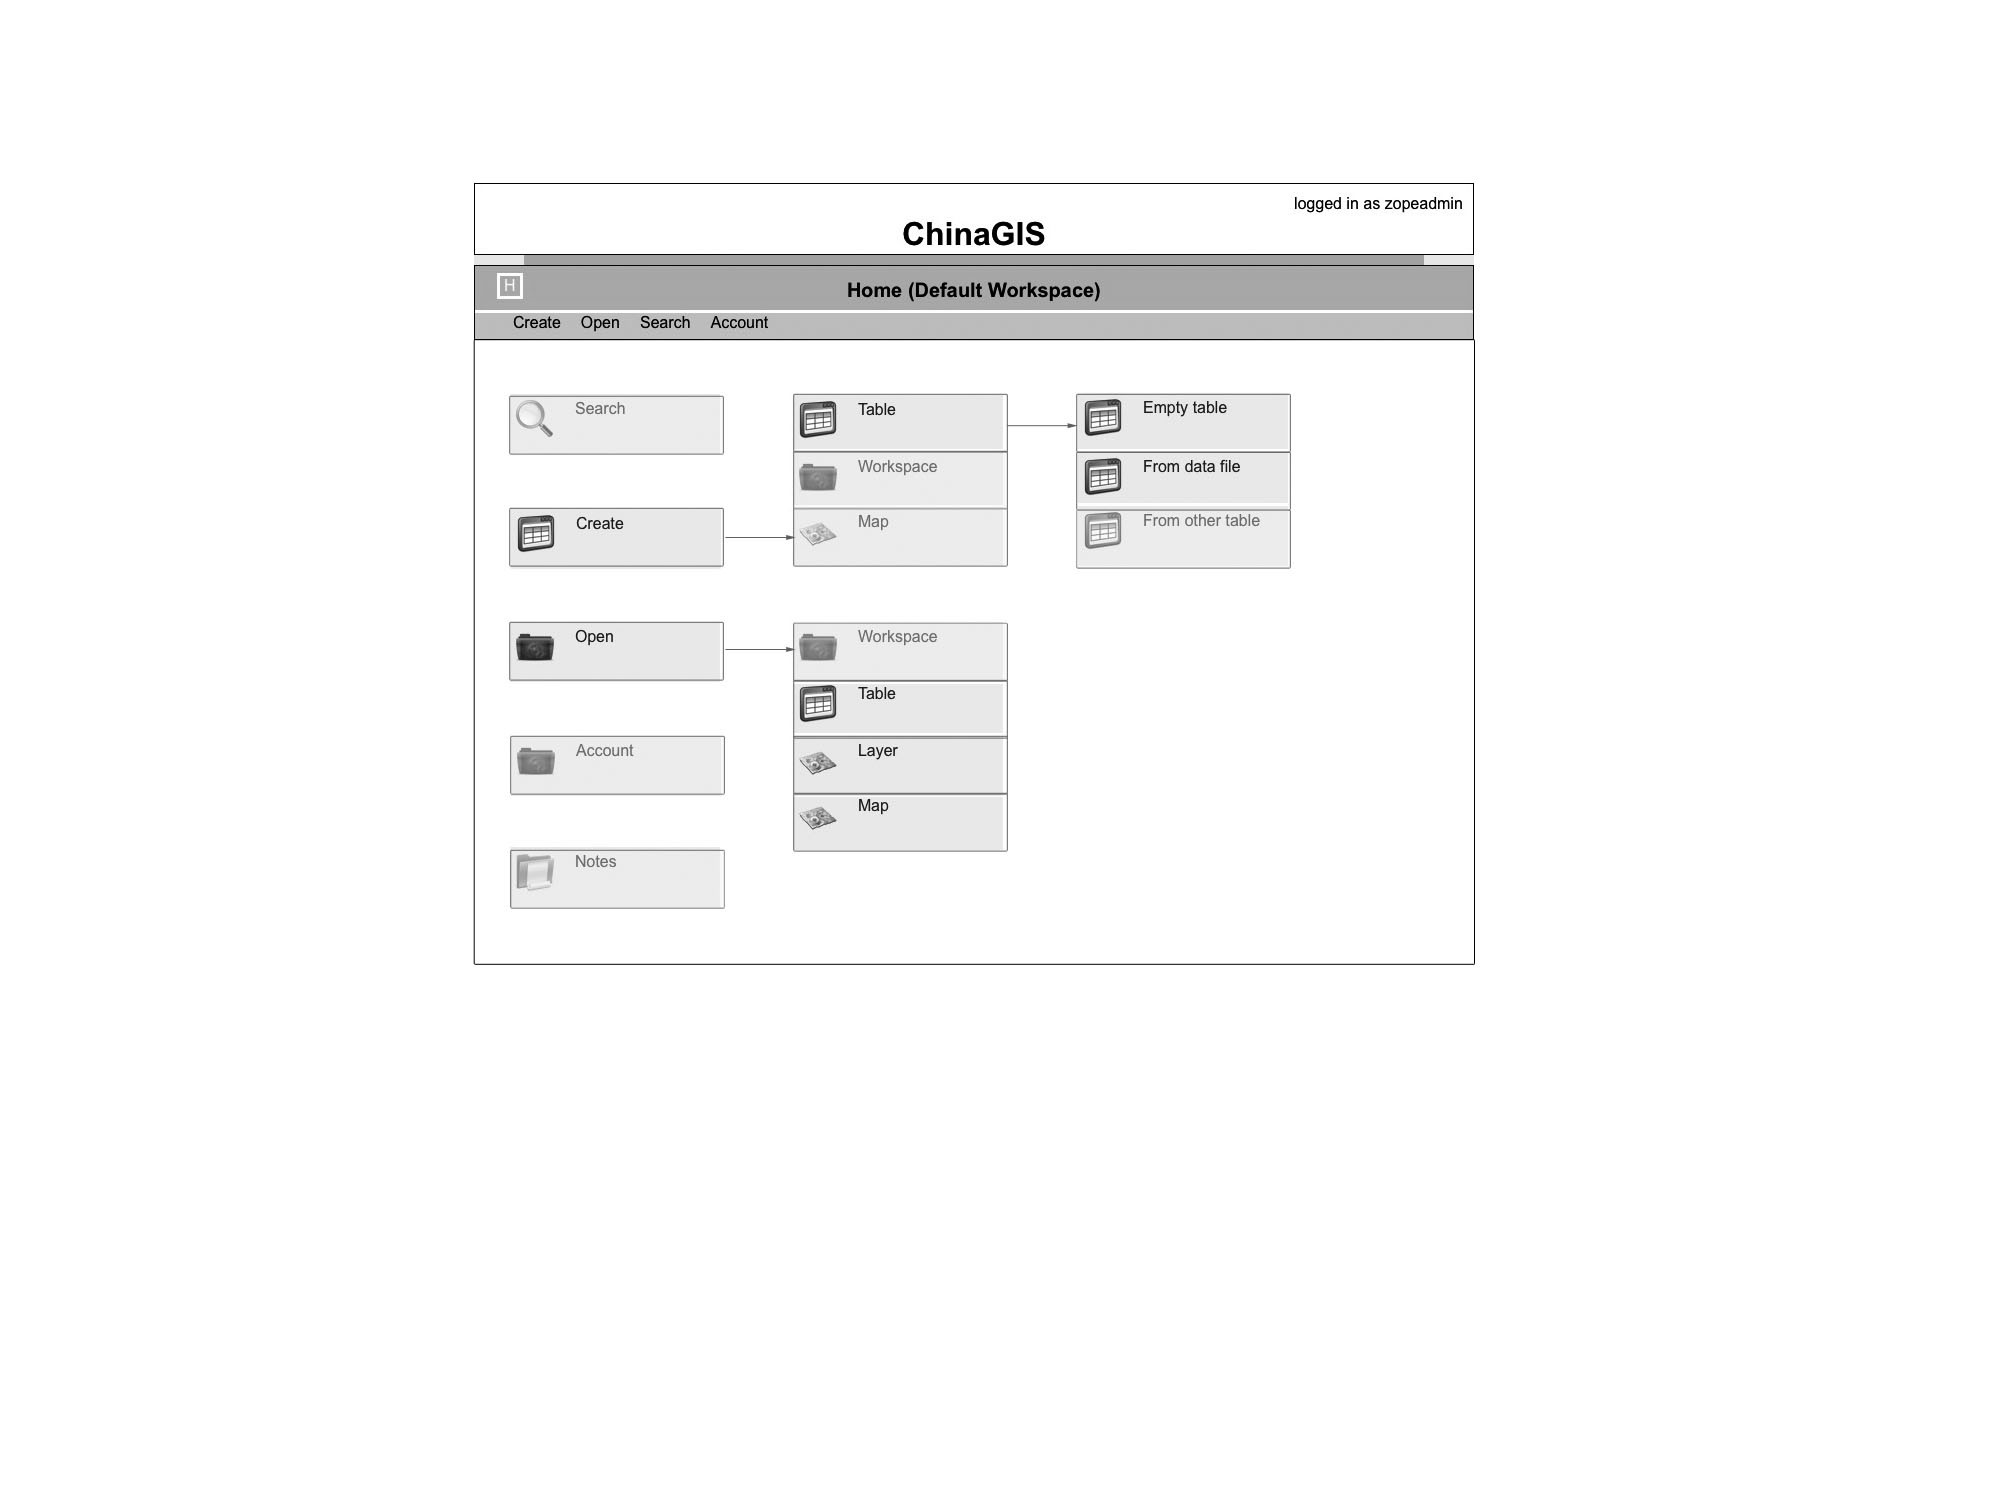
Die Beta-Version können Sie hier testen und bewerten. Die Grafik zeigt, welche Funktionen bereits aktiv sind. Login!
GRAFIK
Einführung für Newbies
- Auf dieser Seite können Sie historische Daten mit räumlichen Bezügen geografisch visualisieren und analysieren.
- Das System arbeitet auf der Basis der <GoogleMaps? API>.
- Sie können sich hier bereits vorhandene Daten als <Karten>(Beispiel SongYingxing?) anzeigen lassen oder <eigene Daten> (Beispiel Tabellen aus Excel) einlesen und verarbeiten. Sie können dazu selbst neue Karten mit den von Ihnen gewünschten Komponenten erstellen und speichern.
- In der Beta-Phase sind die Daten für alle registrierten Benutzer zugänglich. Sie können von allen verändert und gelöscht werden. Sie können Ihre Daten aber extern abspeichern.
- Zum Test des Systems registrieren Sie sich zunächst <hier>.
Attachments (3)
-
ChinaGIS_Fktgrafik_2010-12-20.jpg (191.3 KB) - added by 15 years ago.
ChinaGIS_Grafik_2010-12-20-AK
- ChinaGIS_Fktgrafik_2010-12-20.2.jpg (191.9 KB) - added by 15 years ago.
- ChinaGIS_Fktgrafik_2011-01-12.jpg (103.1 KB) - added by 15 years ago.
Download all attachments as: .zip