| Version 3 (modified by , 8 years ago) (diff) |
|---|
Documentation for the Commentary Visualization tool
The Commentary Visualization is an experimental tool that tries to mix a graphical network display with text-based searching.
The tool is currently only showing Titles with commentary relations.
The tool can be accessed at the URL:
https://ismi-dev.mpiwg-berlin.mpg.de/netvis-ismi/commentaries.html
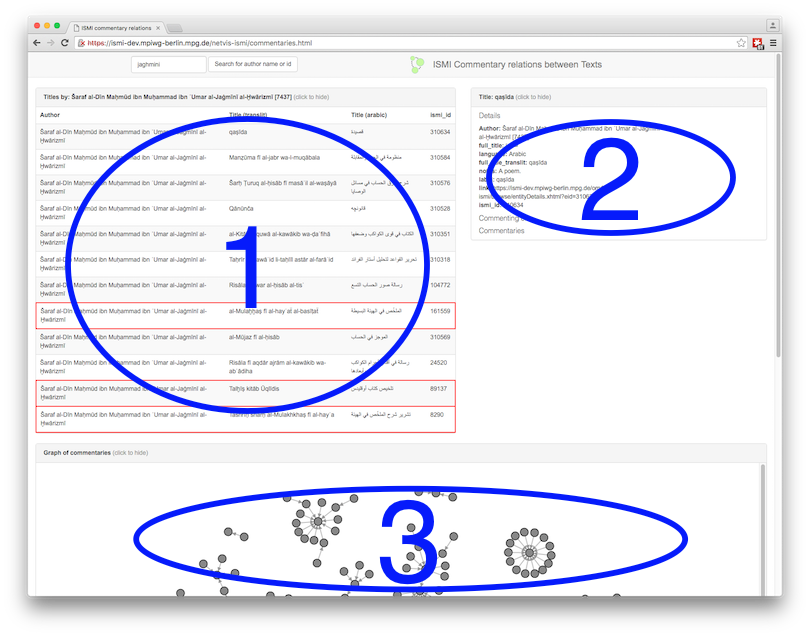
Page layout
The tool works best on a big screen.
The page has three parts:

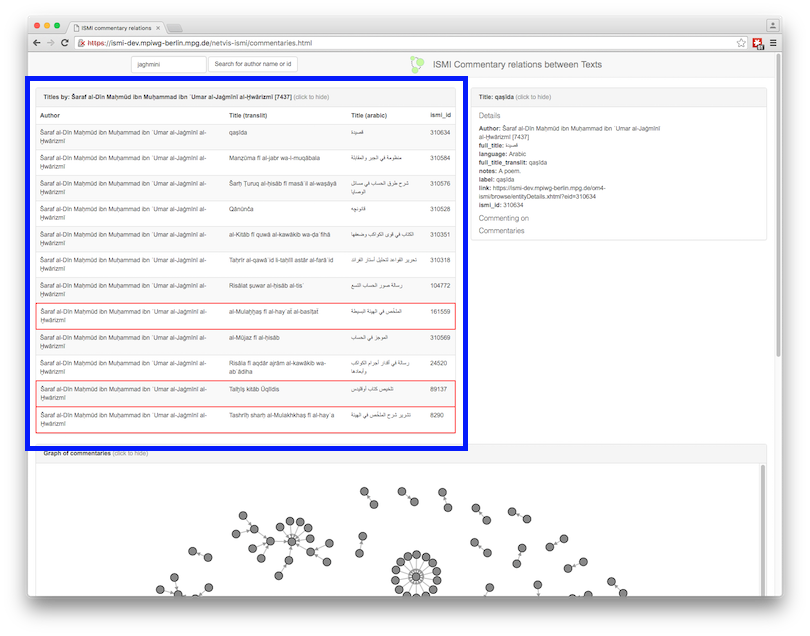
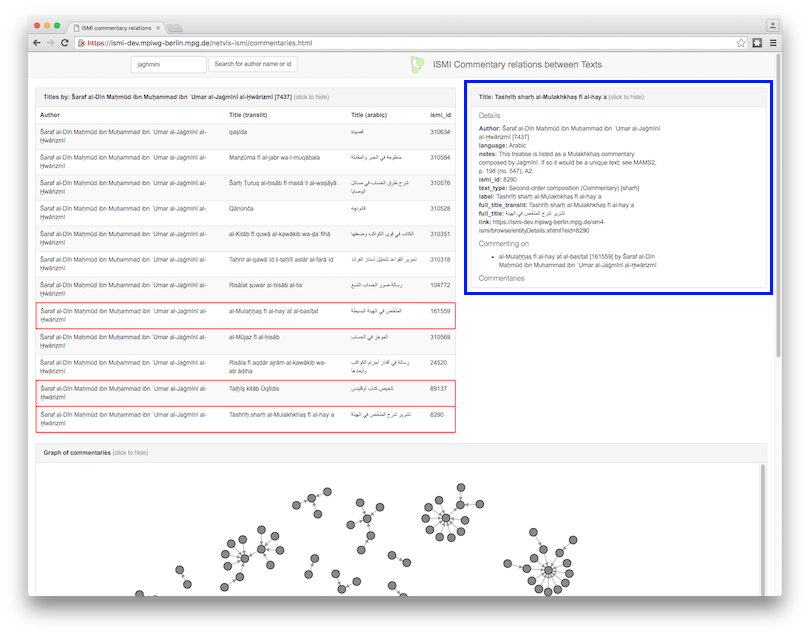
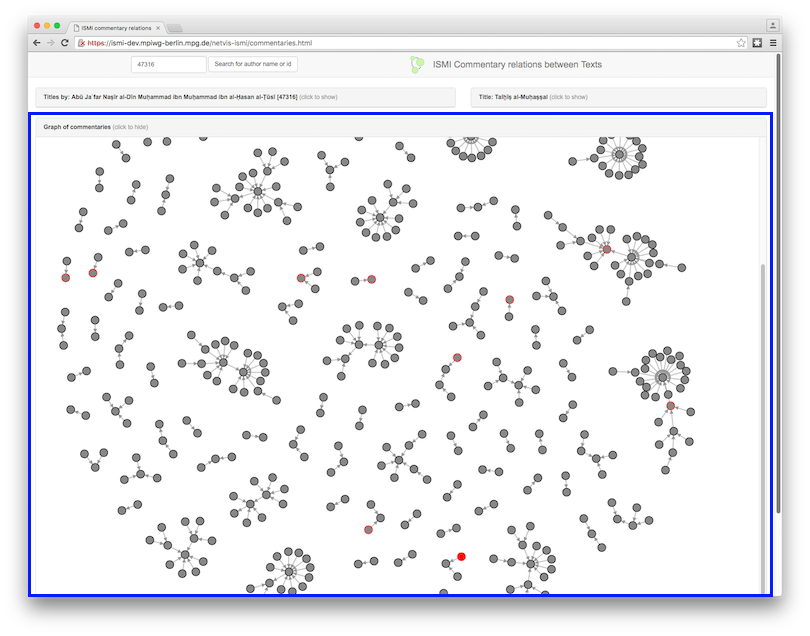
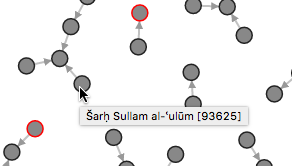
1: the list of titles 2: the detail display of a selected title 3: the graph of all commentary relations
You can collapse all of the three parts by clicking on the "click to hide" text in the title bar.
Starting with an author
You can type the name of an author in the search box in the top left of the page above the title box.
The search uses the transliterated arabic name field in the database and ignores diacritical marks.
Attachments (6)
- cv-overview.png (258.8 KB) - added by 8 years ago.
- cv-tusi.png (87.1 KB) - added by 8 years ago.
- cv-list.png (229.3 KB) - added by 8 years ago.
- cv-detail.png (257.0 KB) - added by 8 years ago.
- cv-graph.png (208.6 KB) - added by 8 years ago.
- cv-graph-tt.png (24.5 KB) - added by 8 years ago.
Download all attachments as: .zip